
Inspected Objects Report
Facilities grouped by fire-risk category
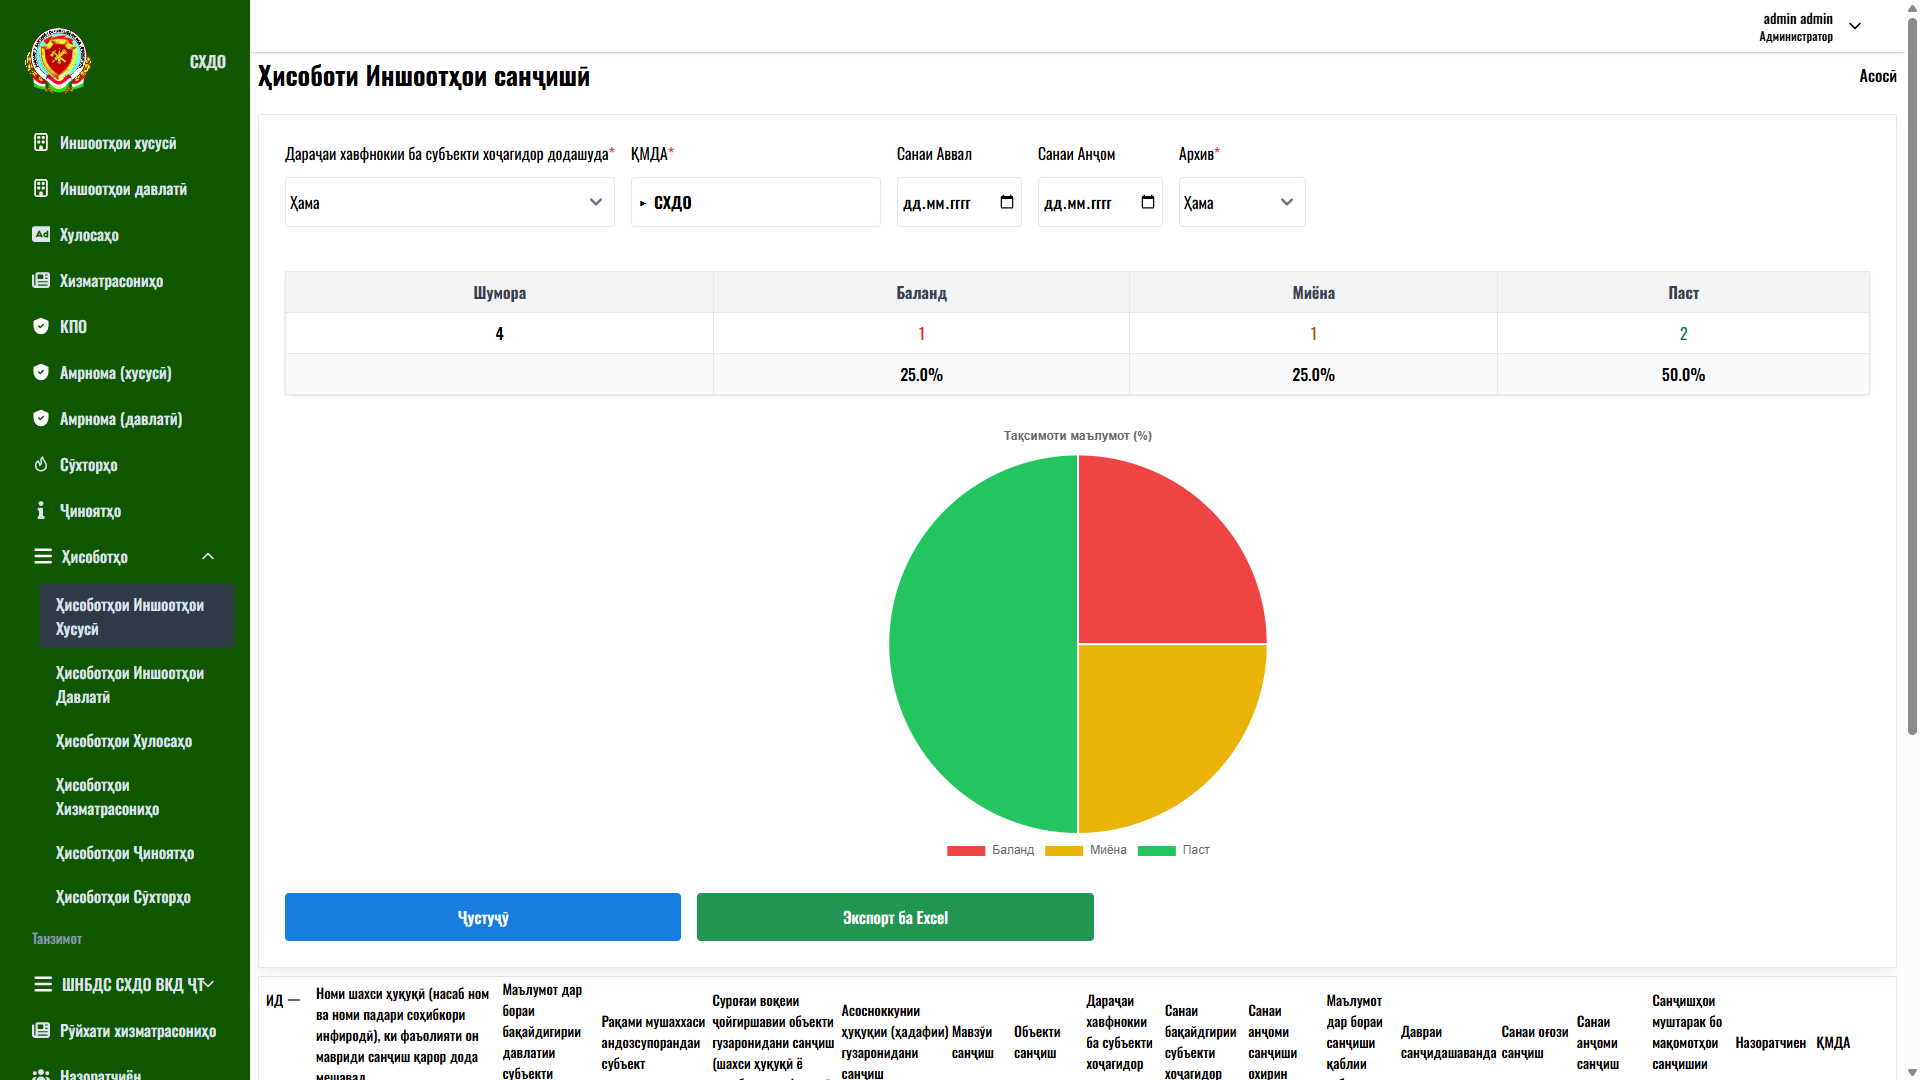
The Inspected Objects Report screen shows how inspected business entities are distributed by fire-risk level. The filter block includes the risk level assigned to the entity, the “KMDA” division, the start and end dates of the period and an archive flag.
The main result is a table with summary figures: the total number of facilities and a breakdown by risk category — High, Medium and Low — with both absolute values and percentage shares. A “Data distribution (%)” pie chart visualises the ratio of risk categories with coloured sectors. At the bottom are “Search” and “Export to Excel” buttons, along with a detailed table with full information on each inspected facility (entity name, address, inspection grounds, inspection dates, inspector and division).
User journey: an inspector selects the risk level and period, generates the report, assesses the distribution of facilities across categories and exports the data for further work.
Business value: risk-based reporting helps plan supervisory activities and concentrate resources on the most dangerous facilities. A risk-based sampling and visualisation model applies to any control and audit system.