

🇬🇧EN
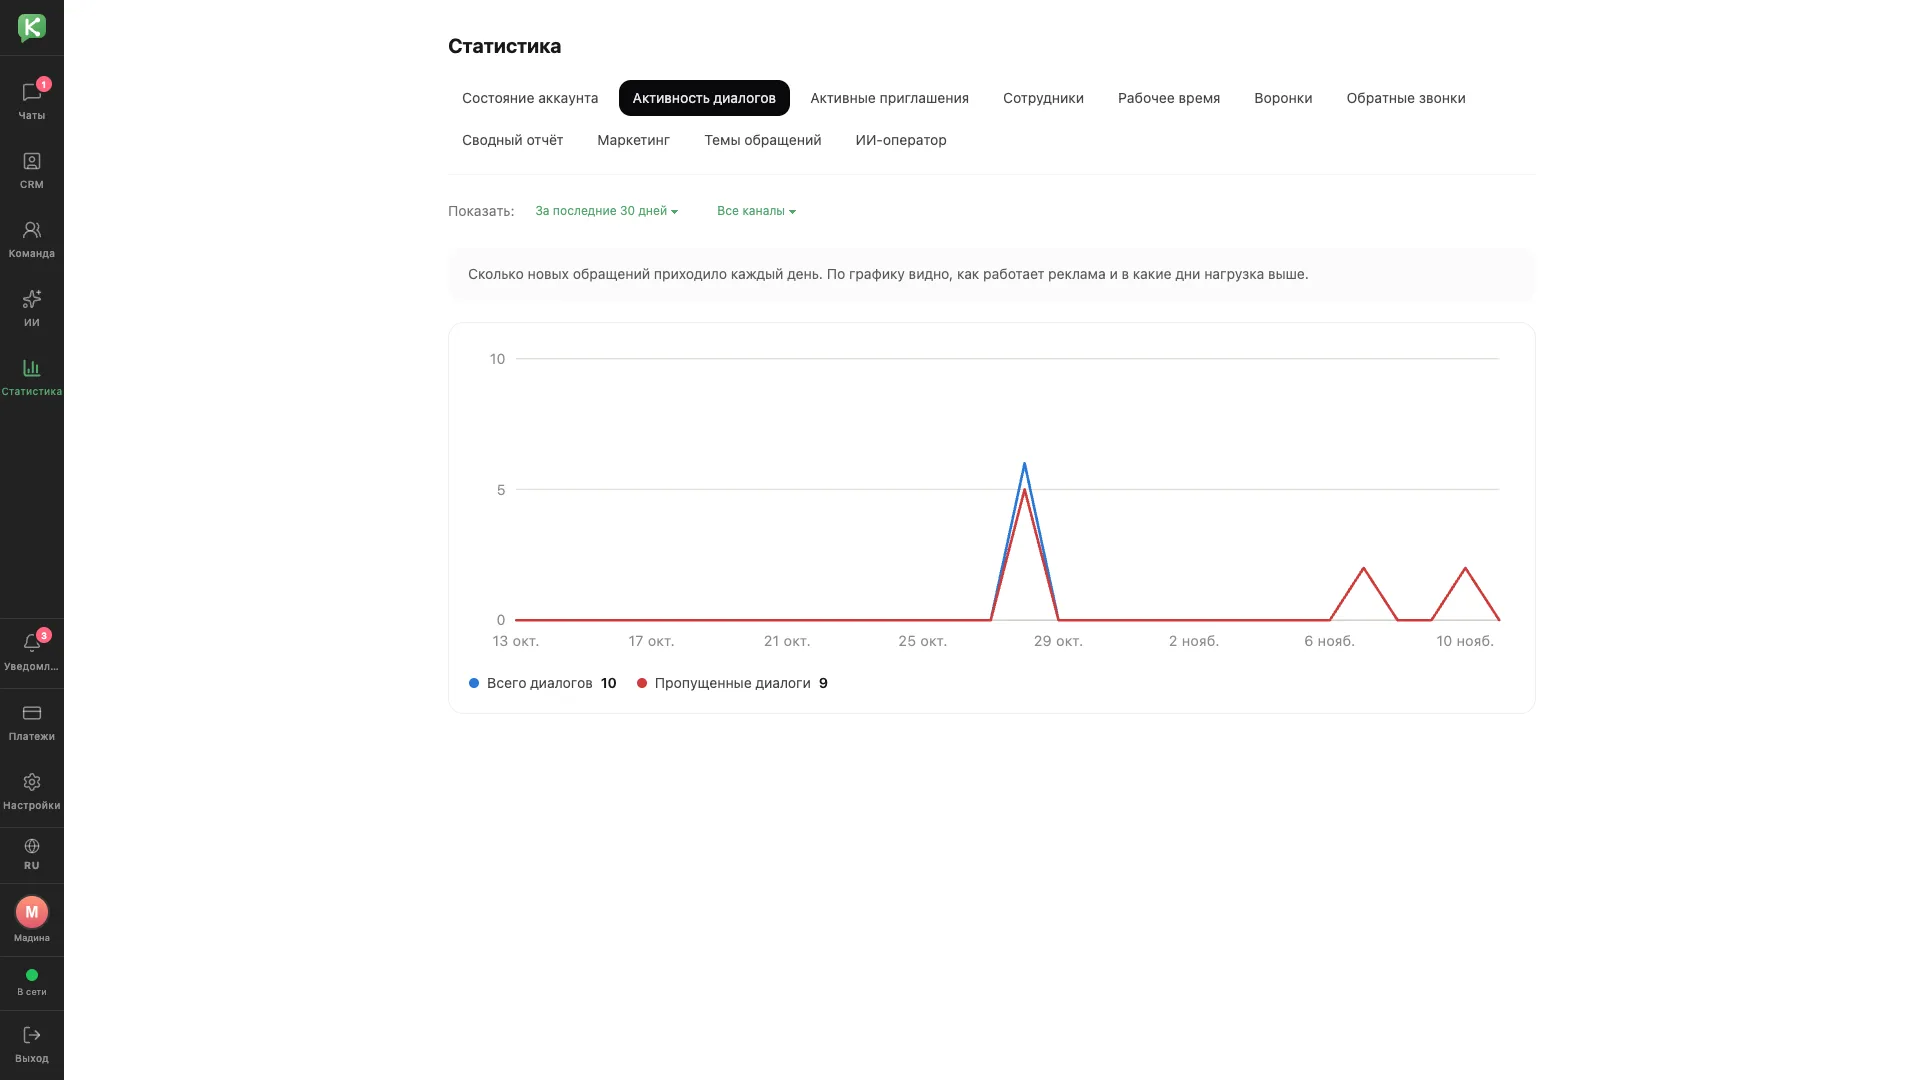
Conversation activity
A chart of new requests and missed conversations per day.
Architecture and functionality: Conversation activity
A chart of new requests and missed conversations per day.
1. Chart
A line chart shows the number of conversations per day from 13 October to 10 November. The blue line represents all conversations and the red line missed ones.
2. Totals
The legend shows period totals: 10 conversations, 9 of them missed. Peaks on the chart mark the busiest days.
3. Use
A note above the chart explains that it shows how advertising performs and which days carry a higher load. The period and channel filters are shared across all statistics tabs.